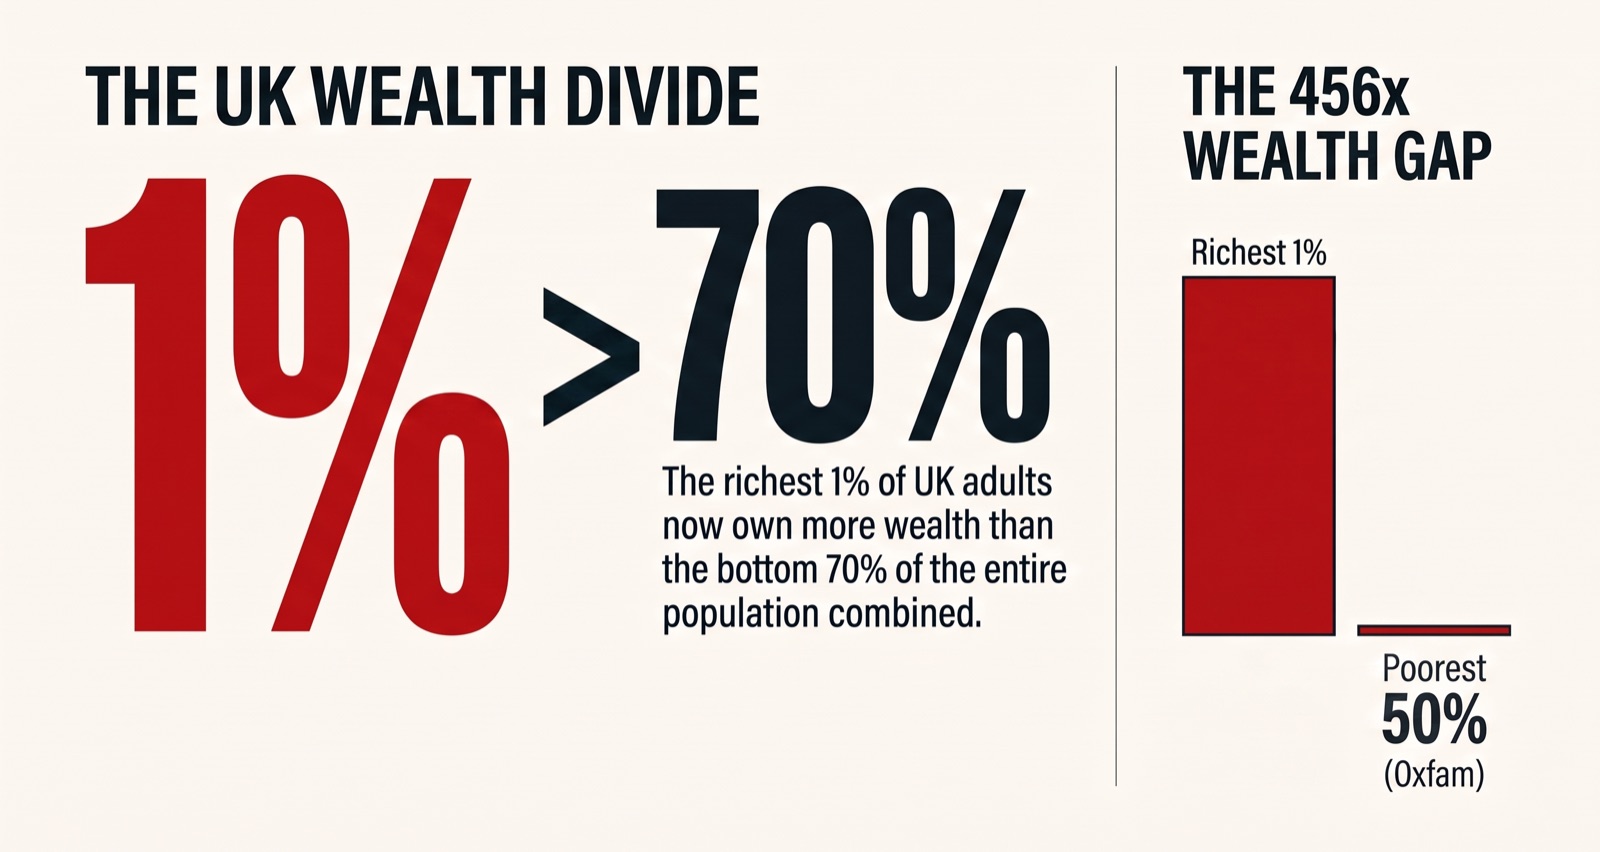
Do the richest 1% really own more wealth than the bottom 70% of people in the UK?
Yes. The richest 1% own 456 times more wealth on average than a person in the poorest 50%, and their combined wealth exceeds that of the bottom 70% put together, according to Oxfam research drawing on ONS data.
When economists talk about wealth inequality, they do not mean who earns more. Wealth is what you own outright: your home, savings, shares, and pension. Income is what lands in your bank account each month. The gap between rich and poor is far wider on wealth than on wages, and the 456x figure captures just how extreme the top end has become.
Oxfam's analysis of UK data found that a person in the richest 1% holds, on average, 456 times as much wealth as a person in the poorest 50%. That is not a rounding error or a statistical quirk. It means the wealthiest fraction of the country could hand every one of the bottom 50% a cheque and still be almost unimaginably richer.
Why does the gap grow so fast? The key is that wealth generates more wealth. If you own a house, shares, or a pension pot, those assets rise in value even when you are asleep. If you own nothing, you pay rent to someone who does, and that rent flows upward. Over decades, asset-price growth has consistently outpaced wage growth, compounding the gap with every passing year.
Official UK surveys almost certainly understate the problem. The ONS Wealth and Assets Survey relies on people self-reporting, and the very wealthy are both less likely to take part and more likely to hold assets in offshore structures or trusts that surveys cannot see. The Office for Statistics Regulation suspended the survey's official statistics accreditation in June 2025 over data quality concerns, suggesting the true concentration is even higher than the headline figures show.
“If you have billionaires growing their wealth at 30, 40, 50% in economies which are lucky if they grow 2%, how fast does cancer grow?”— Gary Stevenson, Channel 4 News interview
Common questions
- How is the 456x figure calculated?
- Oxfam divides the average total wealth of someone in the richest 1% by the average total wealth of someone in the poorest 50%. Both figures come from ONS survey data. The result is the ratio, which Oxfam reported as 456 times.
- Does the ONS confirm this level of inequality?
- The ONS Wealth and Assets Survey records a wealth Gini coefficient of 0.59, which is extremely high. The Office for Statistics Regulation suspended the survey's official accreditation in June 2025, noting the data likely underestimates inequality among the very wealthy.
- Is the UK unusual compared to other countries?
- Globally the top 1% controls 37% of all wealth while the bottom 50% holds just 2%, according to the World Inequality Database. The UK's domestic picture mirrors this global pattern and sits among the most unequal developed nations.
Sources — check them yourself
- Tax the rich: Why we need a wealth tax in the UK Oxfam GB
- Billionaire wealth jumps three times faster in 2025 Oxfam GB
- Wealth in Great Britain House of Commons Library
- Household total wealth in Great Britain quality and methods guide ONS
- How is wealth distributed across British households? Institute for Fiscal Studies